
Research · Inc. 5000 study · September 2026
Same growth, fifty points apart
Before the bid, the deal team writes the value creation plan from the CIM and the data room. Neither one shows how much commercial upside is still left in the company.
We scored 120 of the 2026 Inc. 5000 members to see what that misses. Among the software members, companies that grew at the same rate landed as far as fifty points apart on commercial strategy. The one with the lower score has more upside left to capture, and nothing in the financials tells you which one it is.
Michael Himmelfarb · · 4 min read
- 01
Commercial strategy tracks category leadership, and the financials can’t show it. Remidi high-scoring companies are 4X more likely to become category leaders. Among the software members in this study, the top and bottom thirds by commercial score have the same median headcount, founding year and revenue, and about the same growth.
- 02
Some of the biggest multiple expansion opportunities sit in fast growers. Splitting the software members at the group’s own medians for growth and score, 21 of the 45 faster growers fall below the median on commercial health. Their median growth is 231%. A value creation plan can miss that upside, because nothing in the growth number points to it.
- 03
Clear messaging to a defined customer is the price of admission. Across the 120 companies, 99% name a clear target customer, 93% put hard numbers on the site, 91% state a quantified customer outcome, and 90% have a headline you understand without scrolling. Where they differ is trust built during the buyer journey. Review sites are part of that, so judge them as brand spend, on the trust they build while the buyer is deciding.
- 04
Benchmark for advantage as well as parity. Fewer than one in five software members offer a low-commitment way to start, and about one in five show a visible upgrade path. Benchmarking against peers shows what a company has to fix to catch up. Ground a whole category leaves open is where it can get ahead (Copyleaks, 424th on the list at 822% growth, does both at the highest level we score).
What can’t the financials tell you?
How much commercial upside is still left. Growth sizes the opportunity. The commercial score shows how much of it is still reachable through commercial strategy.
Plot the software members on three-year growth and commercial score, and companies with the same growth land far apart on commercial strategy.
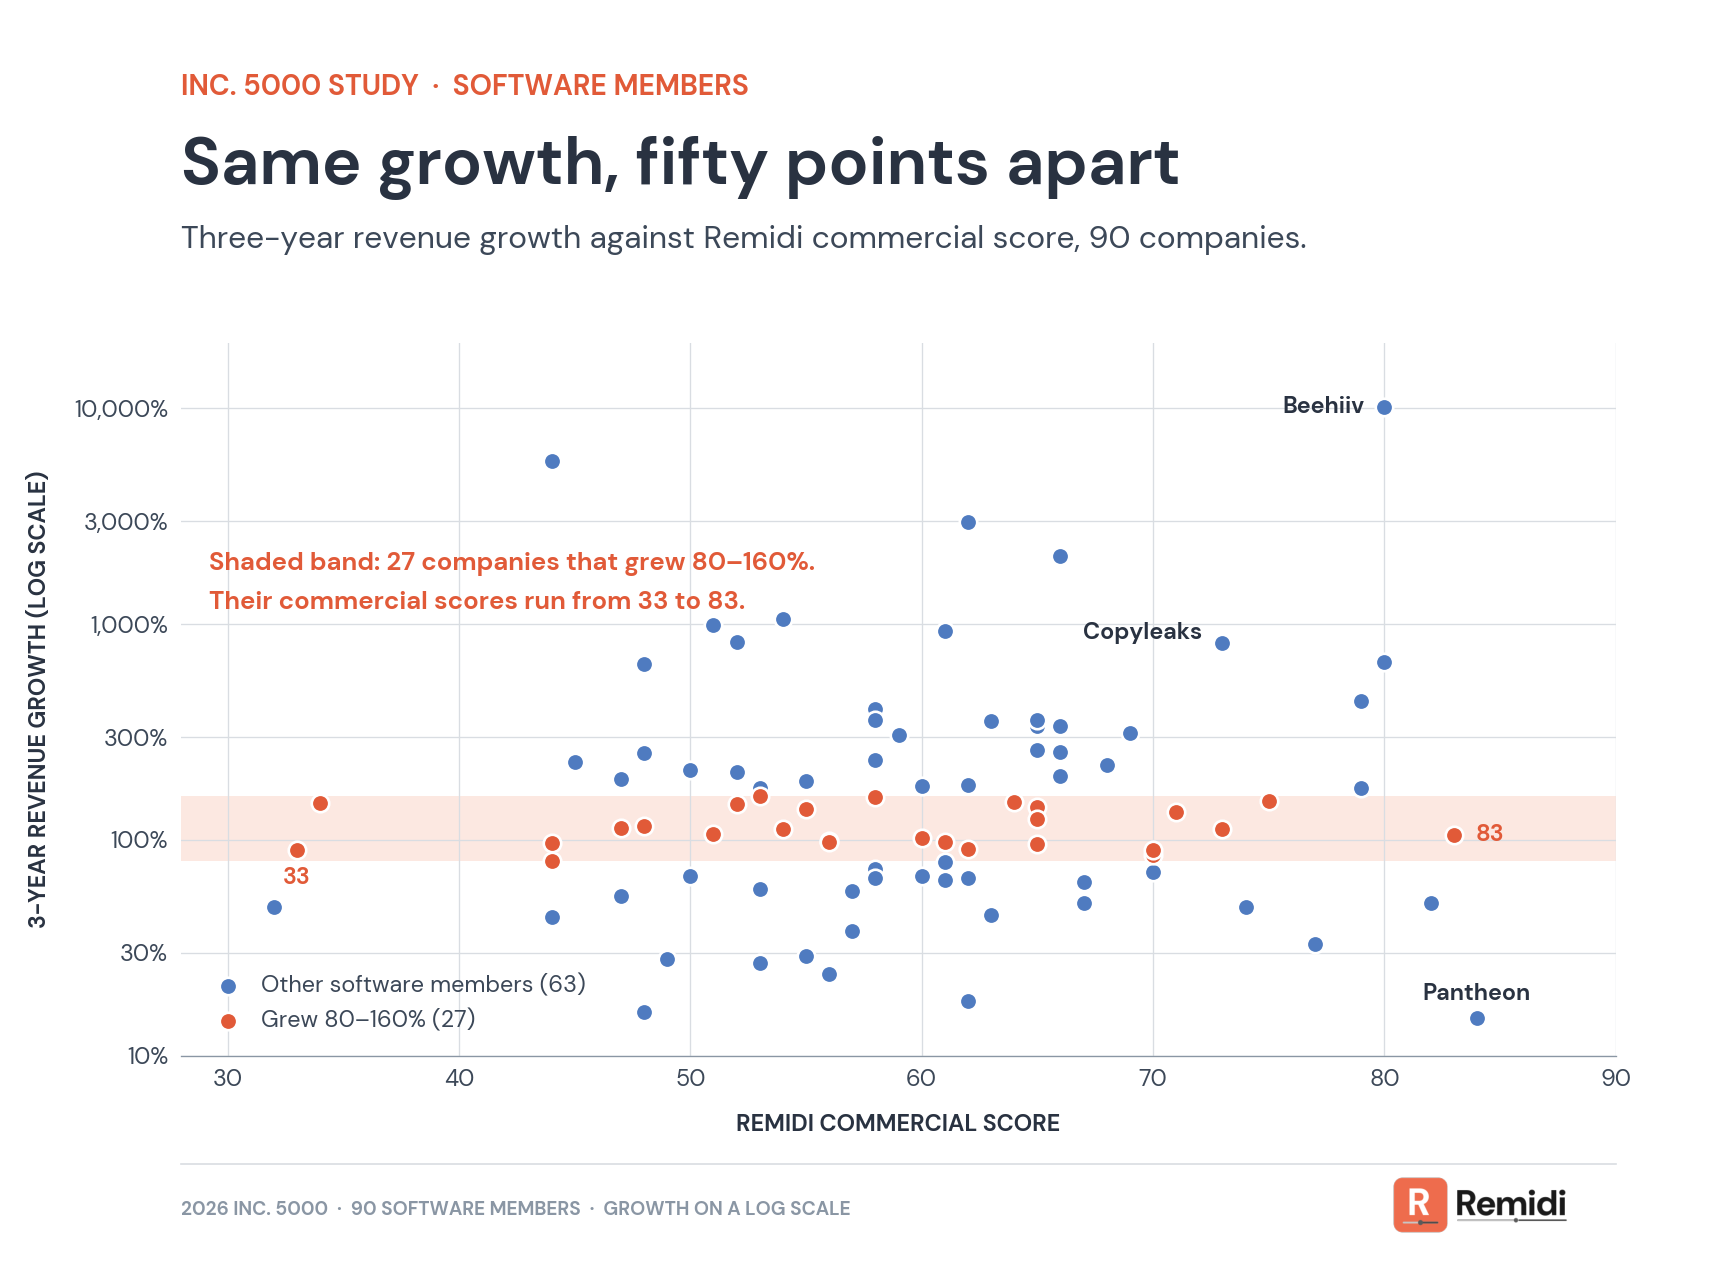
27 software members grew between 80% and 160% over three years. Their commercial scores run from 33 to 83. A deal team would treat those companies as the same story.
The 16 software members scoring 70 or above grew anywhere from 15% to 10,109% (Beehiiv and Pantheon sit at the two ends of that range, and both are near the top of the commercial scale).
What separates the strongest commercial executors from the weakest?
Split the software members into thirds by commercial score, and the top and bottom thirds have the same median headcount (194), founding year (2014), and revenue ($45M). Median three-year growth is 146% vs 128%, a difference that is not significant.
They differ on 25 of the 29 attributes we score. So two companies can look identical in the data room while one has far more commercial upside left to capture: the one with the lower score.
What does that mean for the deal team?
Growth tells you how big the opportunity is. The commercial score tells you how much of it is still reachable, and how cheaply.
A fast grower with a thin commercial engine is often where that upside is largest and cheapest to capture. It belongs in the value creation plan before the bid, while it can still shape the price.
The full paper
Commercial Strategy Lessons from This Year’s Inc. 5000
The paper places the 2026 Inc. 5000 members in Remidi’s Portfolio Prioritizer and works through what closing one gap can be worth, with every assumption stated. It ends with a playbook by role, from the deal team through value creation.
About the study: 120 companies drawn at random from the 2026 Inc. 5000, 90 software and 30 IT services, all with at least 50 employees and $10 million in revenue. The messaging shares are on all 120 companies. Everything else on this page is on the 90 software members. The 4X figure was measured on Remidi’s benchmark corpus of 462 companies. It was not measured on the Inc. 5000 sample.
Michael Himmelfarb is the founder of Remidi. Remidi scores B2B software companies’ commercial execution from what a buyer can see, and benchmarks it for private equity. remidiworks.com