Key Takeaways
- Your weakest commercial dimension sets your ceiling. A company scoring 90 on messaging, 85 on trust, 80 on buyer experience, and 15 on pricing has a 6.5% chance of achieving market leadership. The 15 is doing all the damage.
- Improving all four dimensions simultaneously produces compounding returns. Companies above median on all four win at 48%. Companies above median on three win at 23%. That gap is larger than the first three steps combined.
- At the same overall score, balanced companies win at roughly double the rate of spiky ones with one peak and one valley.
Most value creation plans treat commercial improvements as independent projects. Fix the pricing page. Redo the messaging. Build a case study library. Reduce buyer friction. Each gets its own workstream, owner, and timeline.
The implicit assumption is that each fix delivers value on its own and the total improvement is roughly the sum of the parts.
The data says there's a better approach.
The visibility problem
Most investors and their portfolio companies have good visibility into financials, top-of-funnel lead generation, sales execution, and customer success. What they usually don't have is reliable data on the elements that sit between marketing spend and closed revenue: how pricing is structured, whether buyers can self-educate, how credible the company looks to someone who's never heard of it, and whether the value proposition is specific enough to convert.
Attribution makes this worse. CRM tools default to last-touch, which tells you which button someone clicked, not which combination of signals gave them the confidence to click it. So when conversion rates are low or sales cycles are too long, it's hard to know which commercial element to fix first.
Remidi scores companies across 28 elements in four dimensions: Messaging & Positioning, Pricing & Packaging, Buyer Experience, and Trust & Credibility. We've scored 800+ B2B tech companies and validated the model against market outcomes. Companies Remidi rates Best in Class achieve market leadership at more than 10x the rate of everyone else.
That gives us something most value creation teams don't have: a way to see what's actually holding the commercial engine back. And the answer surprised me.
Your weakest dimension is your ceiling
What happens if you have the best messaging in the world, your marketing and sales engines are humming, but your pricing is a mess?
Growth will be a challenge.
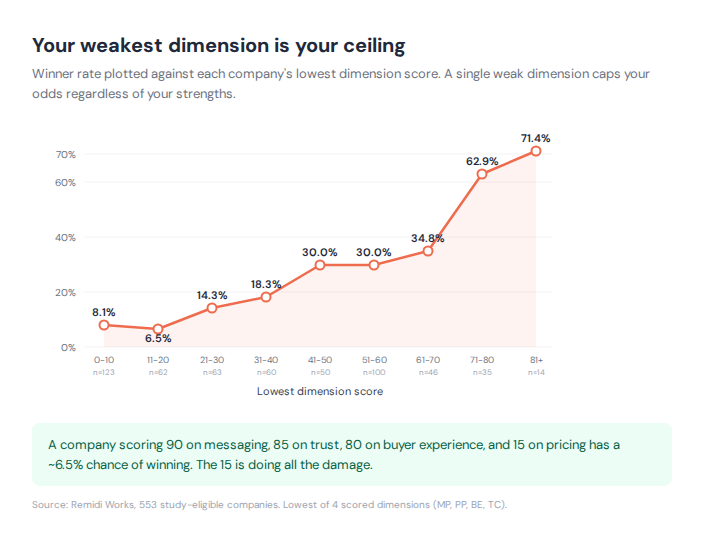
The data is clear. If your company has nailed messaging, trust, and buyer experience but scores 15 on pricing, you have a 6.5% chance of being a market leader. Bring pricing up to the study median of 52 and your odds jump to 30%.
And it's not just pricing. Whatever your weakest dimension is, it's the one setting your ceiling. Winner rates stay flat until the weakest dimension clears about 40, then they accelerate. Below that, nothing else matters much.
A perfect score on one dimension doesn't save you
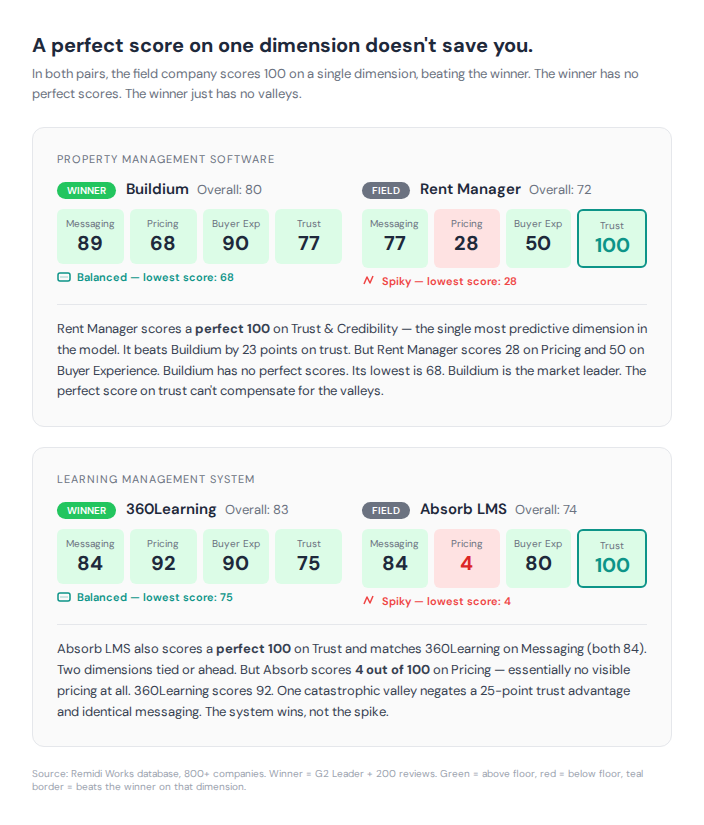
This plays out in direct competition. Buildium and Rent Manager both compete in property management software. Rent Manager scores a perfect 100 on Trust & Credibility, the single most predictive dimension in the model. It beats Buildium by 23 points on trust. But Rent Manager scores 28 on Pricing and 50 on Buyer Experience. Buildium has no perfect scores. Its lowest is 68. Buildium is the market leader.
The 360Learning and Absorb LMS comparison is even more pointed. Absorb scores a perfect 100 on Trust and matches 360Learning on Messaging (both 84). Two dimensions tied or ahead. But Absorb scores 4 out of 100 on Pricing. Essentially no visible pricing at all. 360Learning scores 92 on the same dimension. One catastrophic valley negates a 25-point trust advantage and identical messaging.
The pattern: the field company has a genuine peak, sometimes a perfect score, on one dimension. The winner doesn't have any perfect scores. The winner just doesn't have any valleys.
The multiplier effect
So the weakest link matters. But the next question is: is it better to focus on one area alone?
Turns out, optimizing the entire mix has a compounding effect.
We divided the study population by how many of the four dimensions each company clears the study median on (MP≥76, PP≥52, BE≥60, TC≥60).
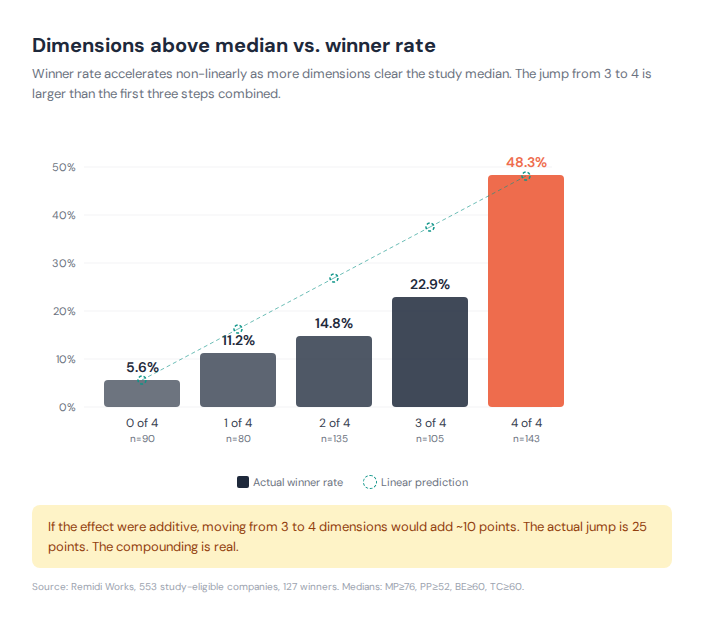
If the effect were additive, moving from 3 to 4 dimensions would add roughly 10 percentage points. The actual jump is 25. The fourth dimension doesn't just help. It unlocks the other three.
To make sure this wasn't just an overall score effect, we controlled for it. Among companies scoring 62-68 overall, those above median on all four dimensions still won at 33% versus 16% for those clearing only two. Same overall score. The balance effect held.
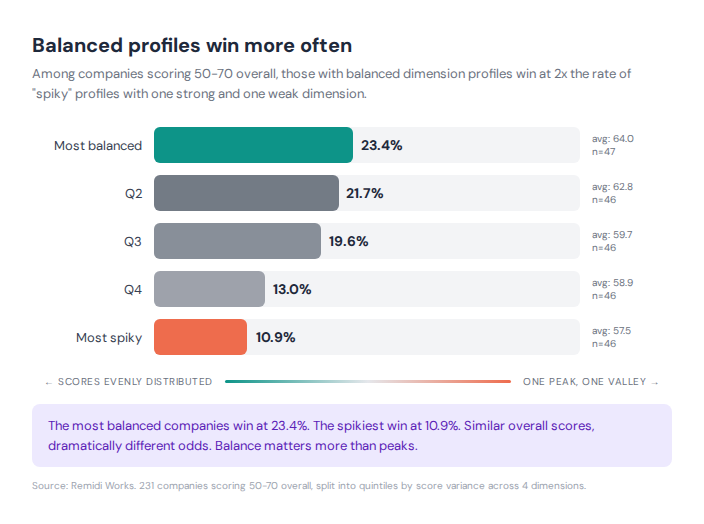
This also shows up when you compare balanced versus spiky profiles among companies in the same score range. In the 50-60 overall band, balanced companies win at 25%. Spiky companies win at 12.5%. Same overall score. Half the odds.
Why this happens
The reason connects back to the attribution problem. Commercial effectiveness isn't a checklist. It's a system. A buyer doesn't evaluate your pricing in isolation. They evaluate your pricing in the context of your messaging, your credibility, and how easy you made it to get started.
A company with strong credibility but a terrible buyer experience is saying: "We're great, but good luck figuring out how to buy us." A company with transparent pricing but no proof points is saying: "Here's what it costs, but we can't show you it's worth it." Neither half-answer converts.
When all four dimensions work together, each one reinforces the others. Trust makes your pricing feel justified. Pricing transparency reduces friction. Low friction lets the buyer see the value. Seeing the value builds trust. It's a flywheel, not a stack.
What this means for value creation planning
There is rarely a single root cause. High churn could be a result of poor user experience, pricing that doesn't reflect value, expectations set poorly in the sales cycle, or some combination. The instinct is to find the one thing. The data says the one thing is usually three things working against each other.
Sequence matters less than coverage. Most 100-day plans pick one or two workstreams to tackle first. This data argues for parallel investment across dimensions. The compounding doesn't kick in until you clear multiple thresholds simultaneously. A company that brings pricing from 15 to 45 while everything else stays flat has moved from 6.5% winner odds to maybe 11%. That's a lot of effort for single-digit improvement. The same effort distributed across two or three dimensions would likely produce a better outcome.
The diagnostic question changes. Instead of "what's our weakest dimension," the better question is "how many dimensions are we clearing the floor on?" A company scoring 80 on Messaging and 35 on everything else looks like it has one strong suit. What it actually has is three problems.
Pricing is the poster child but not the only one. Pricing touches value, which means product, support, competitive positioning, and trust all need to work together to support it. You can't fix pricing in a vacuum any more than you can fix trust by adding a few logos to the homepage. The companies that win treat commercial strategy as a single integrated system, not a collection of departmental projects.

See where your company or portfolio stands
Remidi scores companies across 28 commercial strategy elements and benchmarks them against an 800+ company database.
Get Your Remidi™ Score →